

One Process from QuickBooks to Reporting
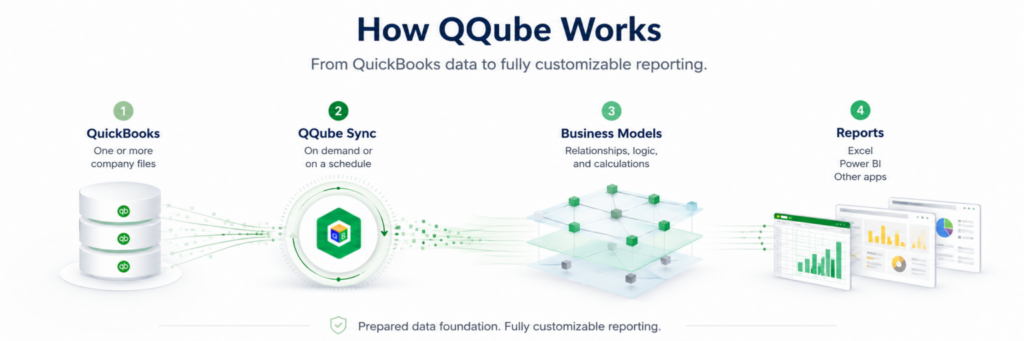
QQube connects to QuickBooks and synchronizes the reporting models you select. During synchronization, QQube organizes and prepares the QuickBooks information for Excel, Power BI, and other reporting applications, so you can focus on the report itself.
1
Connect QuickBooks
Choose the QuickBooks company files to include, and secure authorization and permissions.
2
Sync Reporting Models
Choose the reporting models you need, then synchronize on demand or on your preferred schedule.
3
Build Reports
Start with an included example and modify or build your own report in the application that best fits your needs.
What QQube Prepares Before You Open a Report
Complete Business Models
Lists, transactions, details, and applied activity are organized around complete business subjects instead of raw source tables.
Accounting Logic
QQube connects related records and applies QuickBooks-specific accounting behavior consistently throughout each business model.
Reporting-Ready Output
Friendly field names, calculated values, formatting, hierarchies, and editable examples are prepared for reporting applications.
Prebuilt Does Not Mean Locked
QQube prepares the underlying QuickBooks data foundation. The included Excel workbooks, Power BI files, Access databases, Tableau workbooks, and Crystal Reports are editable starting points. Use the normal capabilities of each application to modify the report or build something entirely new.
Control the Synchronization
Synchronize on demand or on a schedule. Choose the company files and business models that belong in the QQube database. Your saved reports can then refresh against the updated data without repeated exports.
Work Across Multiple Companies
QQube can identify and combine information from multiple QuickBooks company files for consolidation, comparison, filtering, and shared reporting.
Use the Reporting Application That Fits the Job
QQube provides the organized QuickBooks data source. You choose the application that matches the report or analysis, then modify an included example or build your own.
Excel
Spreadsheet analysis, detailed schedules, and traditional financial reporting.

Power BI
Interactive dashboards, dynamic analysis, and reusable reporting models.

Power Pivot
Large-data analysis and advanced calculations inside Excel.

Crystal Reports
Detailed, precisely formatted, print-ready operational and financial reports.

Access
Custom queries, forms, local applications, and familiar Microsoft database tools.

Tableau
Advanced visual analysis for organizations that already use Tableau.
Start with Your Own QuickBooks Data
Evaluate QQube for 15 days or request a personalized demonstration.