
Compare Financial Performance Across Classes
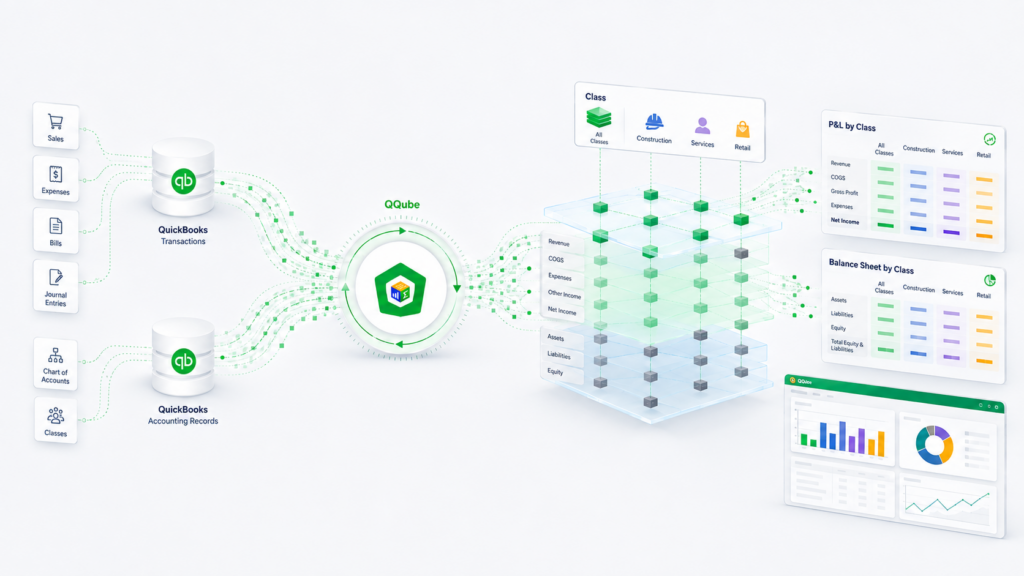
QQube prepares class-based balance sheet, profit and loss, cash flow, advanced comparison, and flexible-period reporting models from your QuickBooks data.
Balance Sheet by Class
Compare class balances across 36 monthly periods with classes across columns or grouped vertically.
Profit & Loss by Class
Review actuals, budgets, percentage of sales, and class comparisons across standard periods.
Cash Flow by Class
Analyze beginning balance, period activity, ending balance, and account-level cash-flow detail by class.
Advanced & Flex Period
For QuickBooks Enterprise, compare actual, budget, forecast, and flexible daily results by class.
What QQube Prepares
QQube prepares the class hierarchy, financial statement structure, period logic, and calculations needed for class-based reporting.
Class Statement Structure
Prepared account and class hierarchies for balance sheet, profit-and-loss, and cash-flow reporting.
Class Layout & Period Options
Place classes across columns or group them vertically across standard monthly or flexible daily periods.
Prepared Measures
Prepared measures for monthly, quarterly, annual, prior-period, prior-year, and class comparison analysis.
See the Reporting Result
Excel PowerPivot Balance Sheet by Class
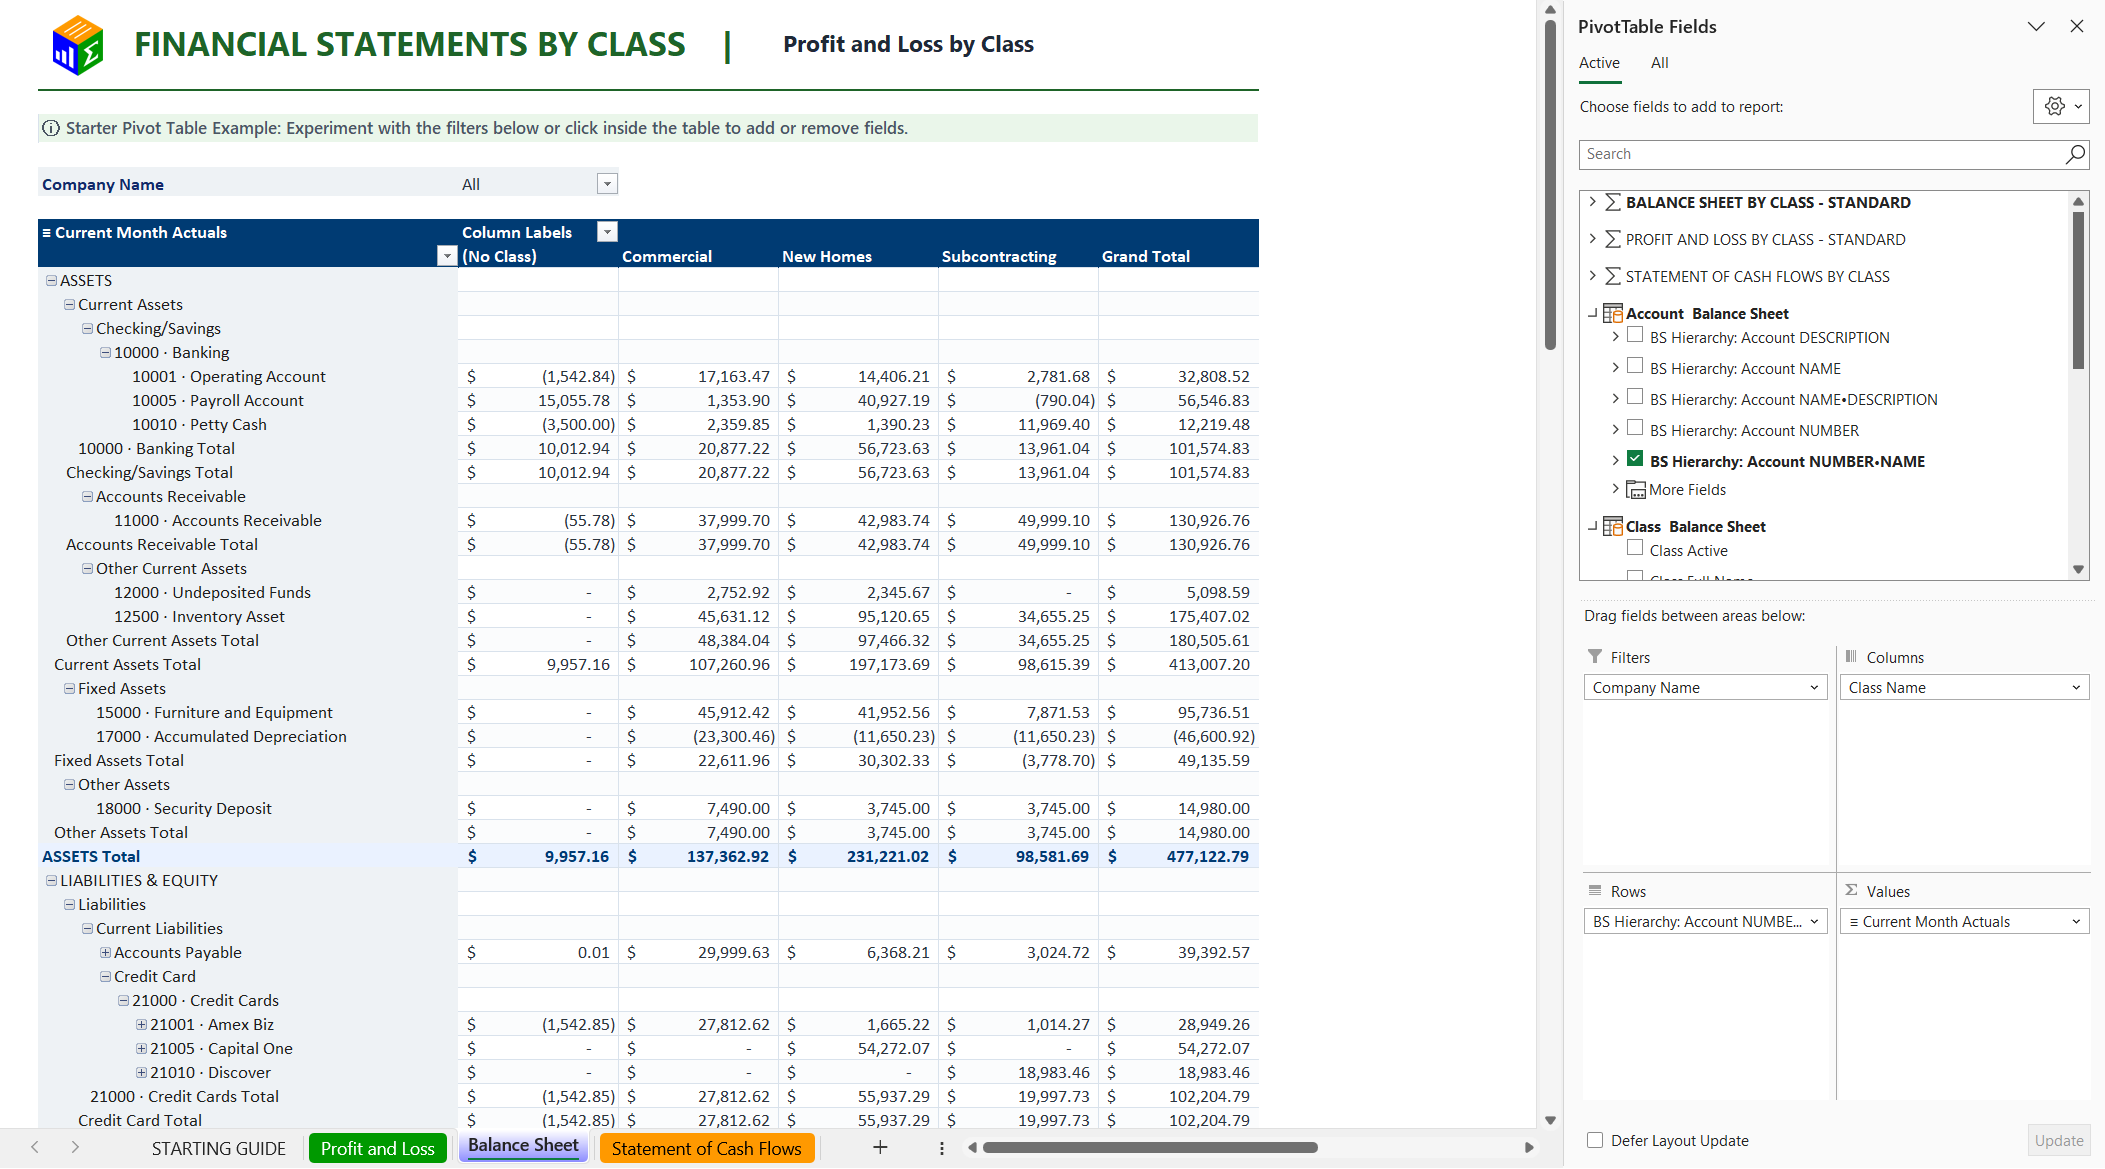
Compare class results across a traditional balance sheet.
Power BI Profit and Loss by Class
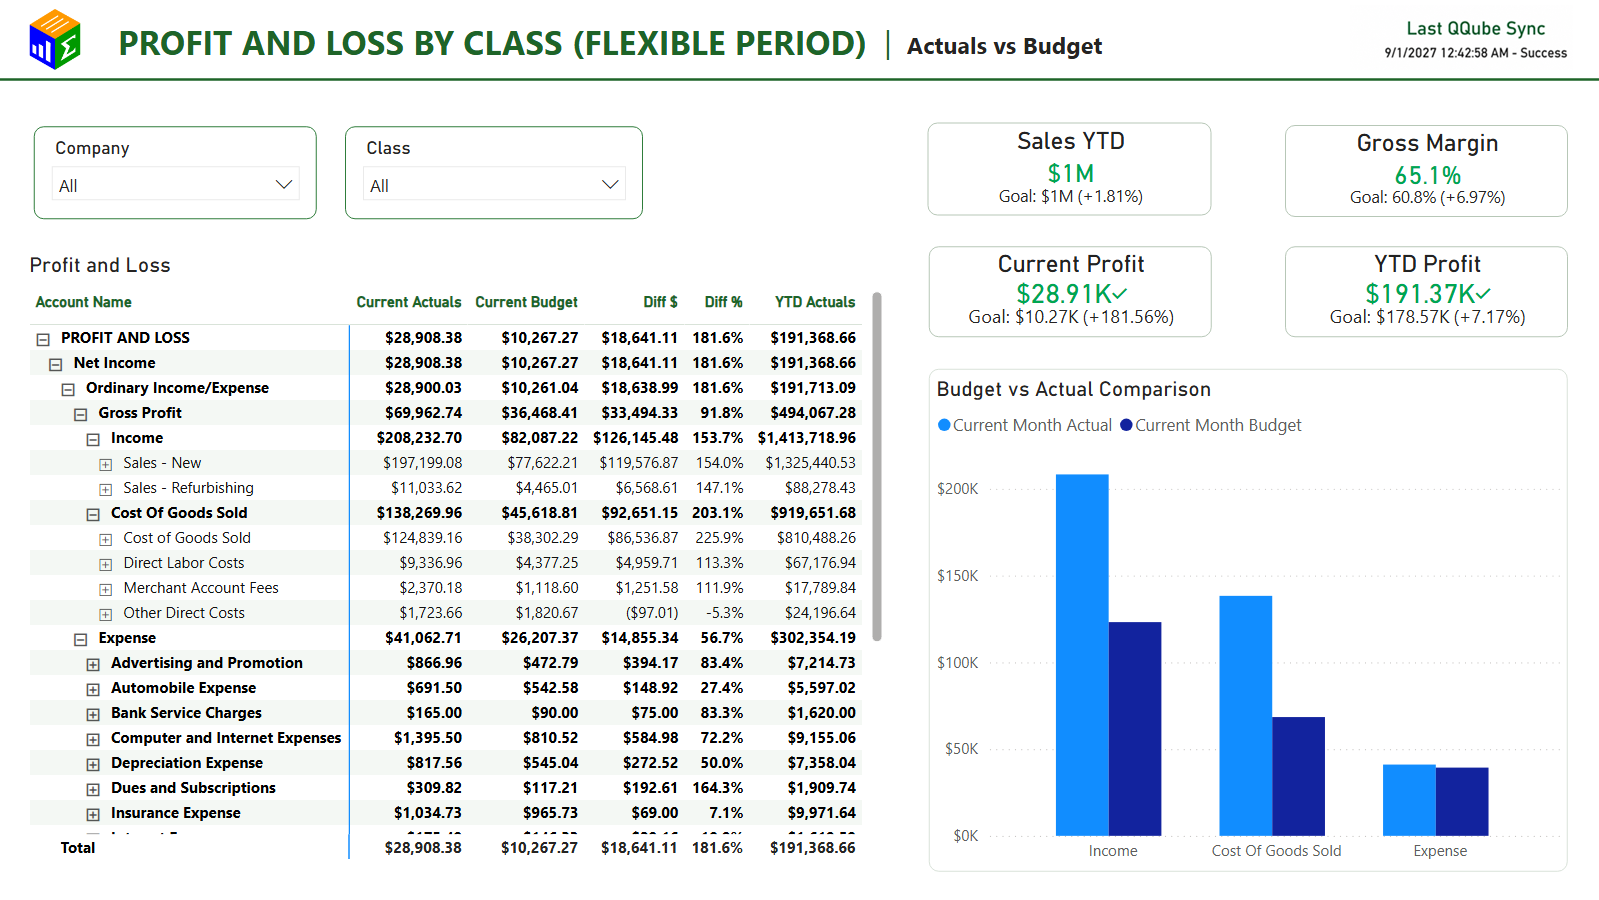
Analyze class comparisons in an interactive Power BI report.
Financial Statements by Class References
Balance Sheet by Class — Standard Period | Profit and Loss by Class — Standard Period | Profit and Loss by Class — Flexible Period
Statement of Cash Flows by Class — Standard Period | Profit and Loss by Class Advanced — Standard Period
Start Reporting on Financial Statements by Class
Connect QuickBooks. Choose the class-based financial statement model you need. Start with an included example.