
You just build the report
Tableau is one of six reporting applications with included QQube examples. Open an example, refresh it with your QuickBooks data, and use Tableau for interactive visualizations, dashboards, and analysis.
- Comprehensive reporting models organized around QuickBooks business subjects
- Prepared calculations, recognizable field names, hierarchies, and formatting
- Included Tableau examples ready to refresh, customize, and extend
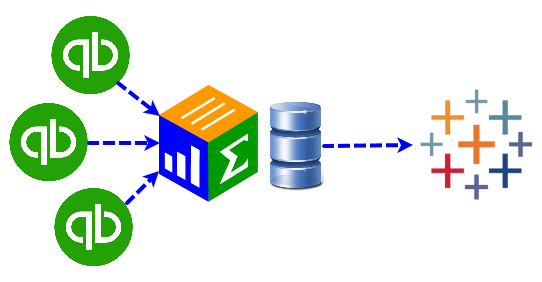
Start with a working Tableau report
Included examples show how a QQube reporting model works in Tableau and give you a practical starting point for your own visual analysis.
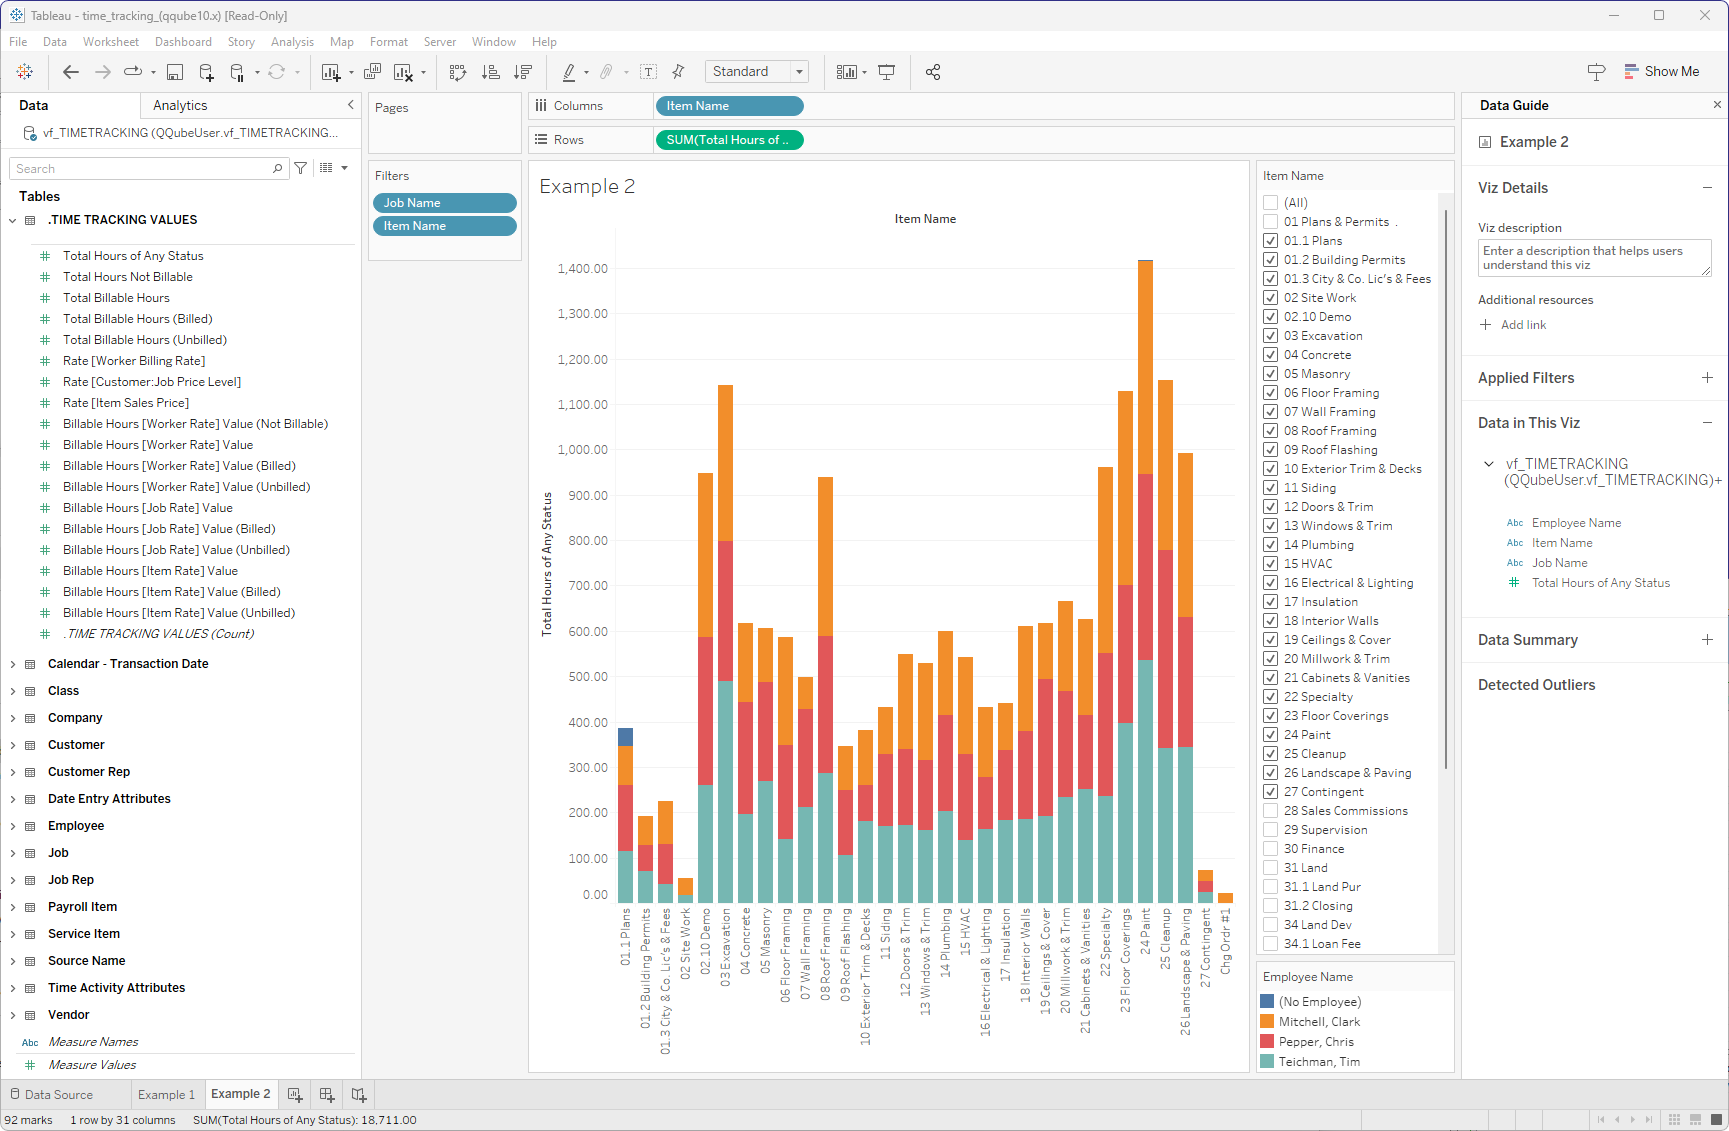
A customizable Tableau report built on the comprehensive QQube Time Tracking reporting model.
QQube prepares what a raw connector leaves to you
A connector extracts QuickBooks data. QQube organizes and prepares it for reporting.
Comprehensive reporting models
Each model is organized around a reporting subject and designed to provide the QuickBooks information available for that subject.
Prepared Tableau structure
Recognizable field names, calculations, hierarchies, and formatting are already prepared for analysis.
Included examples
Open a model-specific Tableau example, keep what works, and customize the visuals for your organization.
Interactive visualizations
Build dashboards and visual analysis from the prepared QQube reporting model in Tableau.
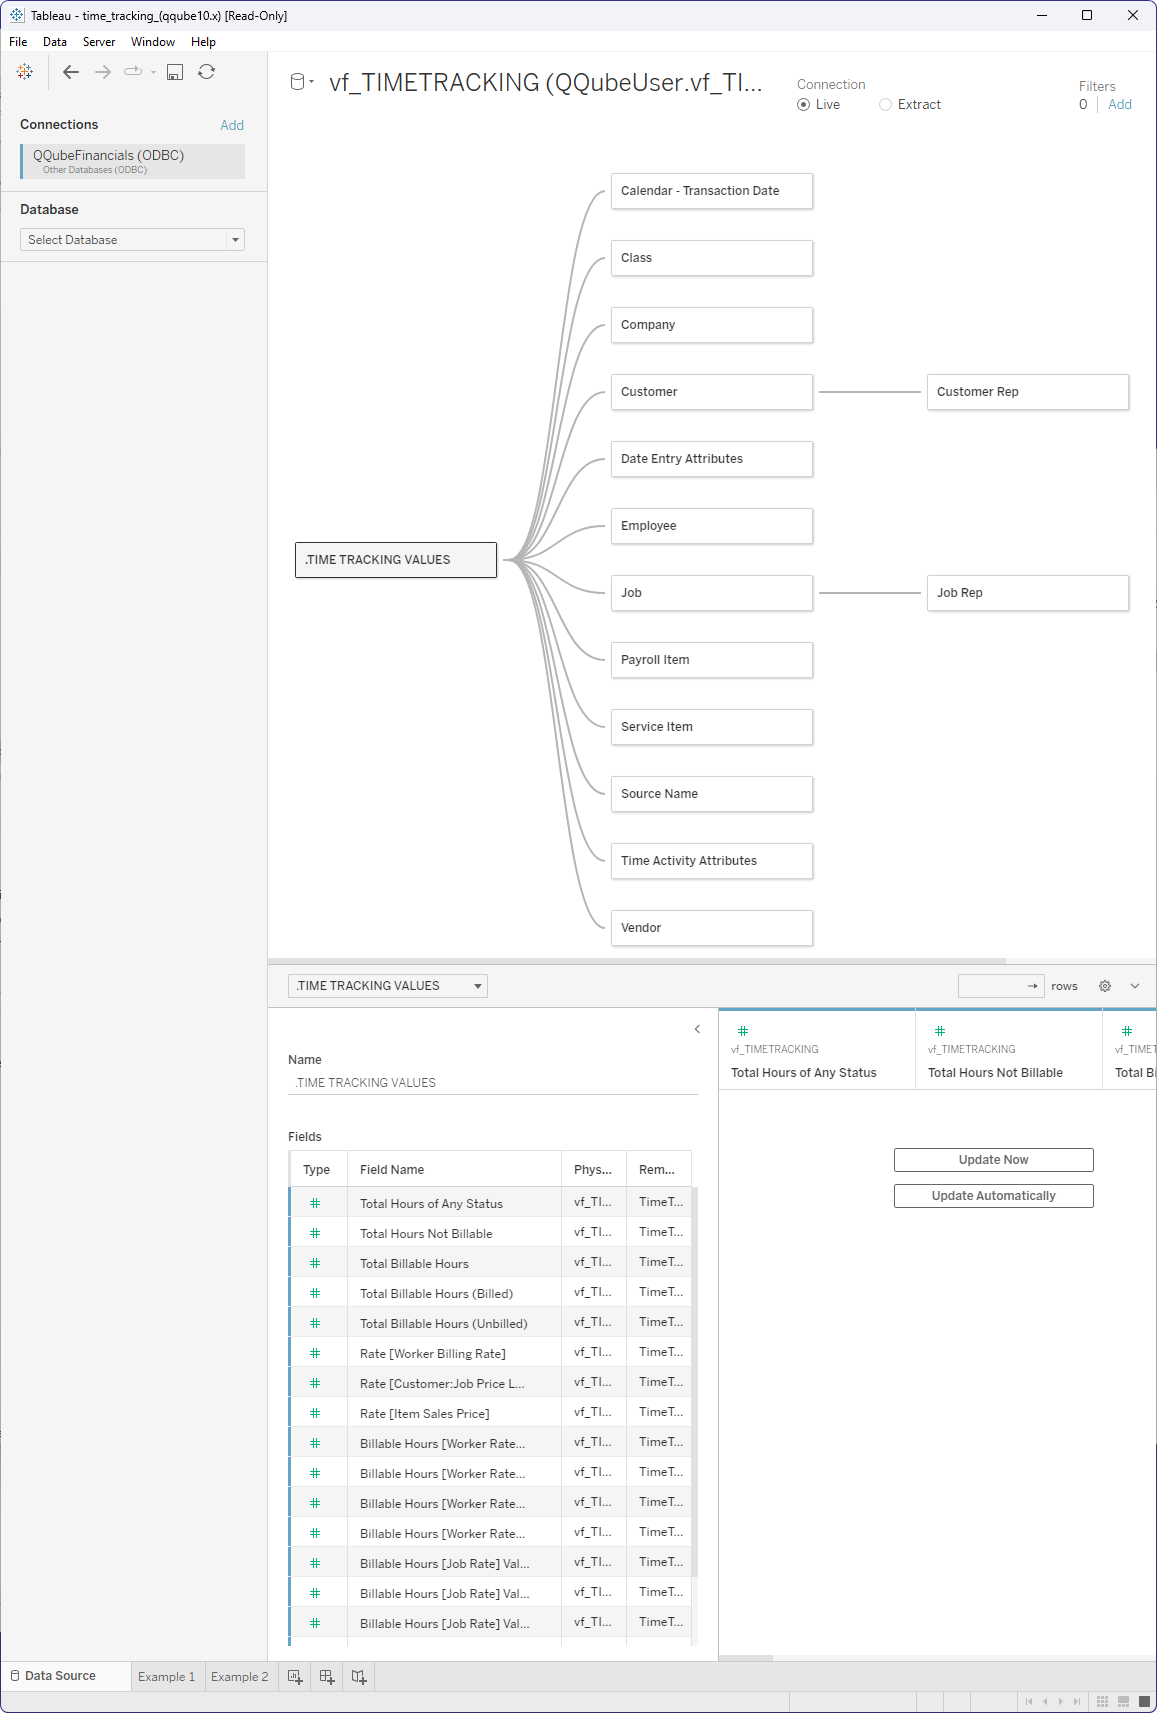
Ready for visual analysis
QQube prepares the reporting structure before you begin building visualizations in Tableau.
- Drag recognizable business fields into Tableau
- Use prepared calculations and reporting hierarchies
- Save the workbook and refresh it as QuickBooks data changes
Start building in Tableau
Connect QuickBooks, synchronize the reporting model you need, and open an included Tableau example.